Markov chain and channel attribution
As Applied to your Google Analytics Data
Applying a Markov chain analysis to your Google Analytics data normally involves a Google 360 account and a friendly data scientist who will extract the relevant data, spin-up R and send you an output table sometime next month. If you're lucky, you might even get a chart.
Wouldn't it be nice if you could run a Markov model against your standard Google Analytics account without manual intervention?
Why would you want to do this anyway? Well, let's just say if you want to properly compare the contribution of your AdWords, Email and Facebook campaigns you're going to need something better than "last touch" or "linear touch" attribution available in Google Analytics.
And if you would like some more background, here are a few links:
https://www.analyticsvidhya.com/blog/2018/01/channel-attribution-modeling-using-markov-chains-in-r/
https://towardsdatascience.com/multi-channel-attribution-model-with-r-part-1-markov-chains-concept-fdd964017626
Back to how it works with Needl. In brief:
- Needl extracts session and hit level data from your standard Google Analytics account.
- Needl archives this data in BigQuery (see data warehousing).
- Needl crunches through the data and calculates, among other statistics, a Markov attribution model based on your campaign data.
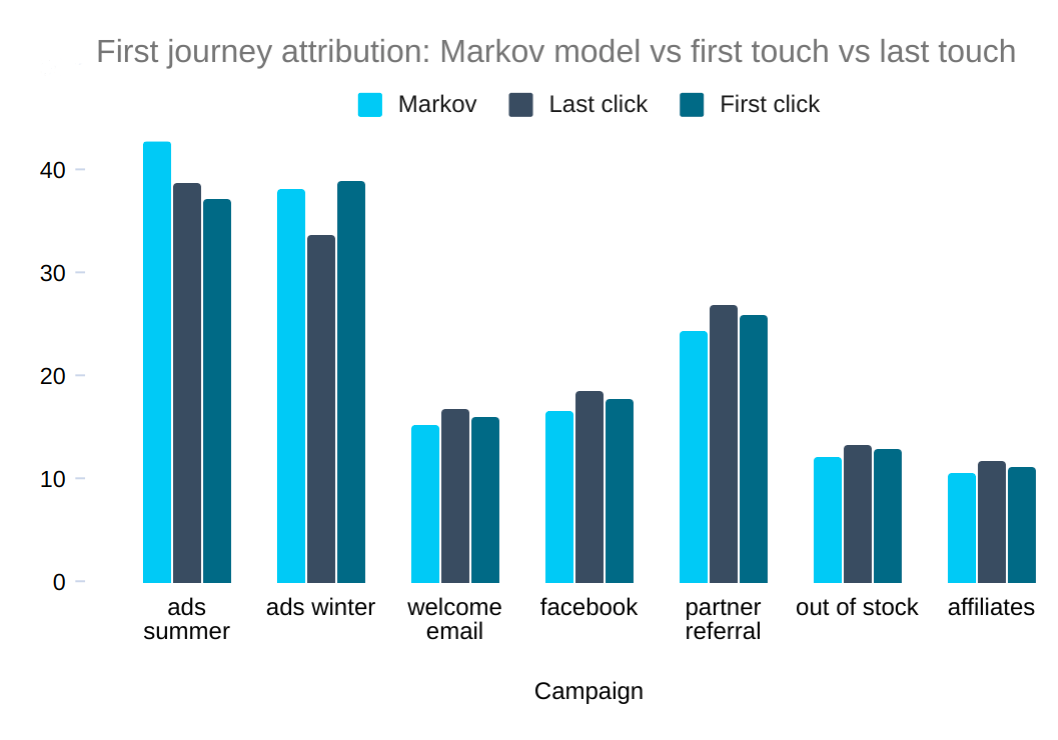
And here's an example chart that compares Markov vs first touch and last touch attribution:

As you can see from the chart, the summer ads campaign is having a more positive impact on sales than either first touch or last touch would suggest. This knowledge could be critical to your bottom line!
How can you apply this great analytics to your data? All you have to do is authorize Needl to access your Google Analytics account.
This is how it works In more detail...
First, Needl splits the analysis into two groups:
- path to first conversion
- paths to subsequent conversions
This is so you can separately assess the process of acquiring customers to that of maximizing revenue, which may well involve a different marketing mix.
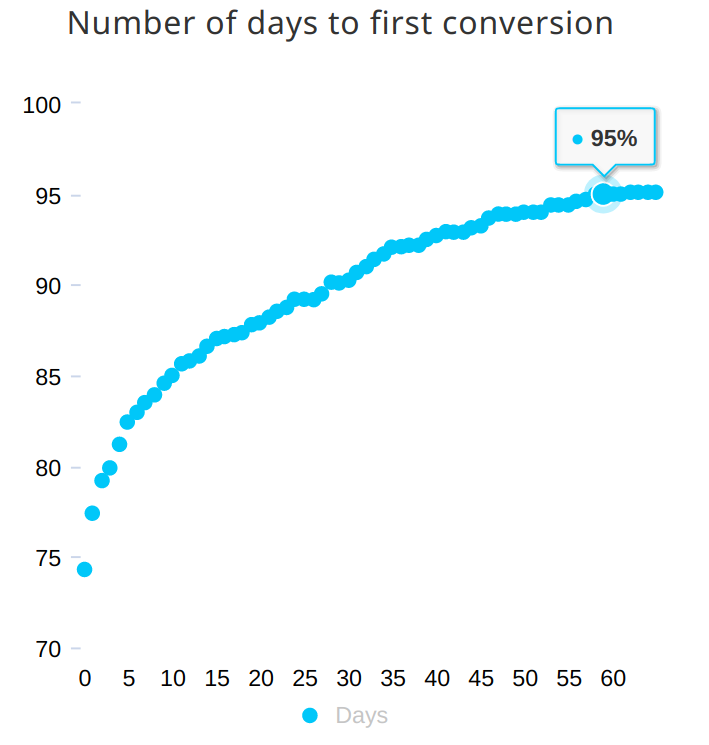
Next, Needl calculates how long it takes from first touch to conversion. Note that this information could be interesting in itself (it's not available in Google Analytics). Since a small number of customers may take a long time to convert (making this calculation awkward) we instead use a "reasonable" benchmark of 95% i.e. how many days does it take from first touch until 95% of customers who are going to convert actually convert.
From the example chart, you can see that 95% of purchases occur within 55 days of a customer's first visit to the site.

Using this window, Needl can now run through the data, building paths, matrices, compute probabilities of moving between states and eventually plot a data-driven model of campaign attribution.
Note that Needl uses a first-order Markov model (less risk of overfitting). If you've read this far a) well done! and b) please feel free to ask us about higher order models — but remember, your data is now in BigQuery so you can always run your own analysis!
Book a demo for free!
